Mapping and navigation functionality is all around us today, from dedicated applications such as Google Maps and Apple Maps to applications with built-in mapping capabilities like Uber, Lyft, Yelp, and DoorDash. These applications provide users the ability to see where they are located, their surroundings, geographical search functionality, and often both the route to a given location and an estimated time of arrival (ETA). The technology to support this geospatial functionality is complex and specialized. Here we will design our very own mapping, navigation, and ETA software solution supporting billions of users and hundreds of millions of points of interest.
- Software Architecture - Delivery and Taxi Transport Platform with Gig-Economy Marketplace
- Software Architecture - Metrics and Alarms Monitoring System
- Software Architecture - Payments System
- Software Architecture - Hotel Reservation Booking System
- Software Architecture - Translations Service & Clients
Contents:
- Requirements
- Background
- Geospatial Indexing
- Graph Theory and Shortest-Path Routing Algorithms
- Map Projections
- Map Rendering
- Visualizing Routes with Routing Tiles
- High Level Design
- Data Models and Storage Requirements
- Infrastructure
- External APIs and Access Patterns
- Domains and Services
- Geocoding
- Points of Interest
- Geospatial Search
- Location
- Routing
- Searching Points of Interest User Flow
- Navigation User Flow
- ETA Changes, Traffic, and Rerouting
- Conclusion
Requirements
Requirements:
- Search points of interest nearby within a configurable straight-line distance running from 0.5 mile to 10 miles
- View detailed information on points of interest
- Update results if the users location changes
- Support 1 billion users
- Support 500 million points of interest with 10% growth YoY
- Store a users location history for a configurable amount of time
- Estimate the time of arrival considering routing, traffic, and other active users
- Support many terabytes of road-connections data as a list of nodes and/or edges
- Support different modes of travel - e.g. walking, biking, driving
- Point-to-point directions from current location to a destination
- Frontend mobile application to render the map, route, and directions
Non-Requirements:
- Multi-stop routing
- Nearby users or friends
- Internationalization and translations
- Multi-region disaster recovery failover
Key User Flows:
- User searches for points of interest near an address or geocoordinates
- User requests navigation to an address or geocoordinate
- User receives real time ETA updates throughout their journey
- Admins may add/remove/update points of interest
Before we dive into the details of the high-level design, services, and workflows, let’s take a step back and discuss some fundamental geospatial software concepts. Additional topics, like internationalization/translations and multi-region failover, are covered in separate articles.
Background
Geospatial Indexing
To build a mapping and navigation application, we need to consider performant ways to store geospatial data, including points of interest, for quick querying. In a prior article, we covered seven different approaches to storing geospatial data, including hashing and tree-based approaches. You can view this content here - Geospatial Indexing.
Graph Theory and Shortest-Path Routing Algorithms
To build a mapping and navigation application, we need to consider performant ways to query a graph of geospatial nodes and quickly determine the shortest path from a start location to a destination node. In a prior article, we covered common algorithms and their optimizations to compute the shortest path in a graph efficiently - Graph Theory and Shortest-Path Routing Algorithms.
Map Projections
Maps are flat representations of a sphere, or more specifically an oblate spheroid. To create a flat representation, a map projection translates the 3D globe to a 2D map. Map projections are inherently imperfect and there are many varities each of which has their own tradeoffs.
The most common map projection is the Mercator projection which is a cylindrical map projection. This can be thought of as wrapping a sheet of paper around the sphere, drawing lines straight out from the sphere to the sheet of paper, and drawing those projected outward points onto the sheet of paper. The Mercator projection suffers from severe distortion towards the poles where shapes are drastically enlarged (e.g. Antarctica, Greenland) and can in turn cause shapes along the Equator map to look disproportionately small (e.g. Africa is bigger than it looks). The Mercator projection gets its popularity from the fact it preserves perpendicular lines of true direction and shows accurate shapes - critical characteristics for nautical navigation purposes in the past.
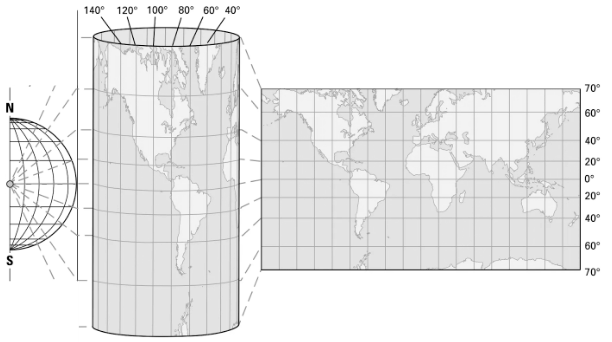
Mercator projection
(straight latitude, straight longitude)
Two other map projections to compare with the Mercator projection, both new from the past century as efforts to address the downsides of the Mercator projection, are the Robinson projection and the WInkel Tripel projection. Both projections improve upon the Mercator in minimizing distortion, shape area error, and shape skew, while sacrificing perpendicular lines of true direction.
The Robinson projection is a pseudo-cylindrical map projection with less distortion but curved lines of longitude, whereas the Winkel Tripel projection is a modified azimuthal map projection with curved lines of longitude and latitude. Both are strong at minimizing distortion, shape area errors, and shape skew with the downside that by balancing these concerns, they are not perfect at any one - there is some distortion, shape area error, shape skew, and it does not have perpendicular lines of true direction. The Robinson projection was commonly found in atlases until it was supplanted by the Winkel Tripel projection. The Winkel Tripel is considered one of the most accurate representations available. That said, we will focus on the Mercator projection as neither of these other two projections are frequently seen in mapping software applications or navigation use-cases.
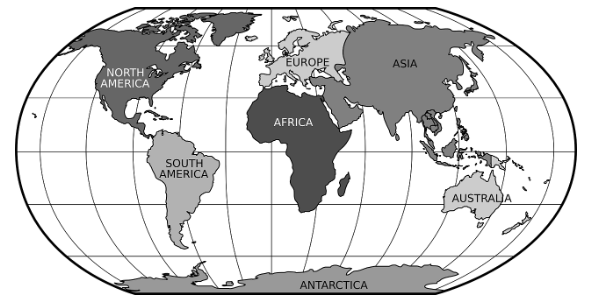 Robinson projection |
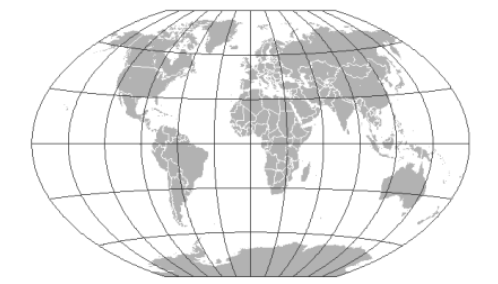 Winkel Tripel projection |
Map Rendering
Mapping applications require multiple levels of resolution in order to render maps at varying levels of zoom. Simply using the highest most detailed level of resolution and zoom would not be performant when zoomed out. At the world-view, consider the compute performance required to render millions of high-res images each of a city block at once versus four zoomed-out images of each quarter of the world.
The standard way of handling map rendering performance is by splitting up the map into a grid where each cell is called a “tile”. The grid of tiles are rendered at the appropriate level of resolution on page load and when a user zooms in or out. When the map zooms in, higher resolution smaller area images are used, whereas when the maps zoom out, lower resolution higher area images are used. These tiles are loaded by the client application and then stitched together. The client only needs to receive the data for the area and zoom-level they are viewing.
There are multiple types of tiles - satellite images, topographical, or roadways for example. These types of tiles can be image-based (e.g. satellite) or vector-based (e.g. roadways). Image-based tiles are larger in size but less demanding on end-users’ hardware as they use pre-rendered images. Vector-based tiles are rendered on the client and so are less demanding on the server. Tiles at each zoom-level are stored statically first in object-storage using AWS S3 and then in a content delivery network (CDN) using AWS Cloudfront, Cloudflare, Akamai, or many other providers to persist these assets as close to the end-user as possible and minimize latency (e.g. https://cdn.sample-mapping-application.com/tiles/v1/{geohash}). Clients only download and render the required tiles at the required zoom-level from the CDN. Tiles are downloaded and rendered on the initial page load, on subsequent map panning or zooming, and throughout navigation as the user is routed to their destination.
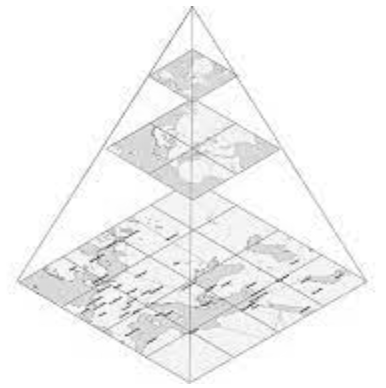
Mapping tiles with multiple zoom levels
Visualizing Routes with Routing Tiles
To visualize the route on the map, like the map itself, we also leverage tiles and of multiple resolution levels. Routing tiles are overlaid on top of the mapping tiles using tiles of multiple levels depending on its placement along the route. Since the algorithms used for routing like Dijkstras and A* are sensitive to the size of the road route network graph, using multiple levels of resolution allows us to minimize the number of nodes considered when computing the optimal route. For example, the route tile for your current location and destination will use a much higher resolution tile containing all local roads, whereas the intermediary tiles along the route may only require highway nodes.
A background async processing job will precompute the graph routing data into routing tiles at multiple zoom levels which can be retrieved by the client. Each routing tile contains the list of graph nodes and edges contained in the tile and references to adjacent tiles it connects to. These tiles together form the interconnected network of roads which can be rendered on the client.
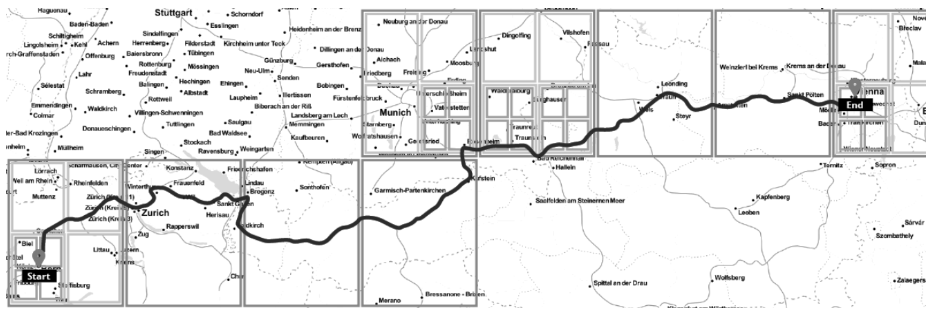
Routing tiles with 3 zoom levels
High Level Design
Data Models and Storage Requirements
Let’s consider what data we will need to persist and query for within this system and then perform some back-of-envelope space calculations to determine what our storage requirements will be. This will help inform the persistence options we may consider, especially considering the large scale this system will support.
Points of Interest Details
- Table schema:
[pointId, name, pointType, description, address, lat, lng] - Access pattern: read-heavy, we will scale with read-replicas
First, we calculate the storage requirements for point of interest details. If each point of interest contains a point-ID (4 bytes), name (100 bytes), point-type (1 byte), description (768 bytes), address (100 bytes), lat (8 bytes), and long (8 bytes) that is 989 bytes which we will round up to 1 Kilobyte. For 500 million points of interest that requires ~500 Gigabytes; including a buffer for future growth we will require 1 Terabyte of space for point of interest details. For scalability, this data and access pattern are well fit both for read-replication and sharding by region (e.g. geohash prefix). Given different regions will have vastly different density of points, multiple less dense regions may map to a single shard.
Geospatial Search Index for Points of Interest
- Table schema:
[geohash, pointId] - Access pattern: read-heavy, we will scale with read-replicas
Next, we calculate the storage requirements for geospatial search. Understanding the spatial indexing approaches detailed in the section above, the Geohashing or any of the tree-based approaches (eg. Quadtree, Google-S2) will fit our needs. In this solution, we will go with Geohashing for simplicity and its support for cheap disk-based storage instead of requiring in-memory generation and storage. Each row in the geospatial index will include a compound key of geohash and point-ID. By keeping points within the same geohash as separate rows rather than a single row containing a list of point-ID’s, we simplify the logic of adding/removing points. For our use-case, we will support geohashes of 4 chars (~12mi radius) up to 6 chars (~0.3mi radius). If each point contains geohash (4 bytes) and point-ID (8 bytes) that is 12 bytes. For 500 million points of interest stored at 3 increasing levels of resolution that is ~6 Gigabytes, including a buffer for future growth we will require ~12 Gigabytes of space for geospatial search. For scalability, this data and access pattern are well fit both for read-replication and sharding off region and/or point-ID.
User Location History
- Table schema:
[userId, timestamp, lat, lng] - Access pattern: write-heavy, we will use a no-sql database partitioned on userId
For user location history we will store the user-ID (4 bytes), timestamp (8 bytes as we don’t require fractional seconds), lat (8 bytes) and long (8 bytes) which is 28 bytes per user per location interval. We will use a 1 minute interval and assume users are active on average 10% each hour and visit on average 14 destinations a week. From 0 to 4 hours we will store this user location history at 1-minute granularity, then from 4 hours to 2 weeks we will store only destinations a user has navigated to. For 1 billion users, that will be (1 billion users * 28 bytes * ((60 minutes * 10% active * 4 hours) + (14 destinations * 2 weeks)) is ~1.46 Terabytes. This can be optimized further by reducing resolution for timestamps further in the past and moving history to cold-storage, similar to strategies used in the Metrics and Monitoring post. For scalability, this data and access pattern are well fit for sharding off user-ID.
The location dataset will be large with high write volume, the data is not relational, and has no strong consistency requirements so a no-sql database makes sense here. Two options to consider for persisting this data are DynamoDB and Cassandra. DynamoDB is a key-value no-sql database whereas Cassandra is a column-oriented database. Both databases are highly available with leaderless server nodes. Cassandra’s query language is much closer to SQL than DynamoDB’s query language, though Cassandra must be managed in-house whereas DynamoDB is a managed service managed by AWS. Given both technologies will suffice we will go with the lower operational overhead option in DynamoDB.
Traffic
- Table schema:
[tileId, edgeId, trafficLevel] - Access pattern: quickly changing temporal data which can be recomputed, we will store this in a distributed in-memory persistence store (e.g. Redis)
Traffic data will be stored in-memory as it will quickly change and if in the worst case the data can easily be recomputed from the location history data. Traffic information will be stored by routing-tile-id and edge-id. The routing-tile-id represents the smallest routing tile containing both the start and end destination locations, whereas the edge-id is the specific edge (i.e. road) between two graph nodes where there is traffic. When the ETA Service receives traffic updates it applies the traffic data on top of the route provided by the Route Planning Service using the routing-tile-id and edge-id.
Mapping and Routing Tiles
CDN URL pattern: https://cdn.sample-mapping-application.com/tiles/v1/{geohash}
The tiles used within the client will be accessed directly from external object storage in AWS S3 and cached at the user’s closest point-of-presence (PoP) using Amazon’s Content Delivery Network (CDN), CloudFront, though many other providers are options we could consider too. Though the tile data will be very large, multiple petabytes, we will skip calculating the storage requirements for the mapping and routing tiles as they will be stored externally from our backend services in object-storage which has significantly easier and cheaper storage flexibility. These tiles are mostly static and are very well suited for caching; clients will only download and render the specific tiles they require from the CDN for an optimal user experience.
Infrastructure
- Edge Router - network firewall, DDOS protection, block list, authentication, authorization, rate limiting
- CDN - store precomputed map tile images and routing tiles
External APIs and Access Patterns
- GeoSearch Service - query for nearby points of interest (high read, low write)
- GET:/geo/search/v1/{lat, lng, radius, filters}
- GET:/geo/search/v1/{address, radius}
- Points Of Interest Service - details on points of interest (high read, low write)
- GET:/geo/point/v1/{id}
- GET:/geo/point/v1/{ids}
- POST:/geo/point/v1
- PUT:/geo/point/v1/{id}
- DELETE:/geo/point/v1/{id}
- Location Service - user location and history (low read, high write)
- GET:/geo/user-location/v1/{id}
- GET:/geo/user-location-history/v1/{id}
- PUT:/geo/user-location/v1/{id}
- Geocoding Service - address to geocoordinate lookup (high read, low write)
- GET:/geo/coordinates/v1/{address}
- Navigation Service - routing directions and ETA (high read, low write)
- GET:/geo/directions/v1/{lat, lng}
- GET:/geo/directions/v1/{address}
- GET:/geo/eta/v1/{id}
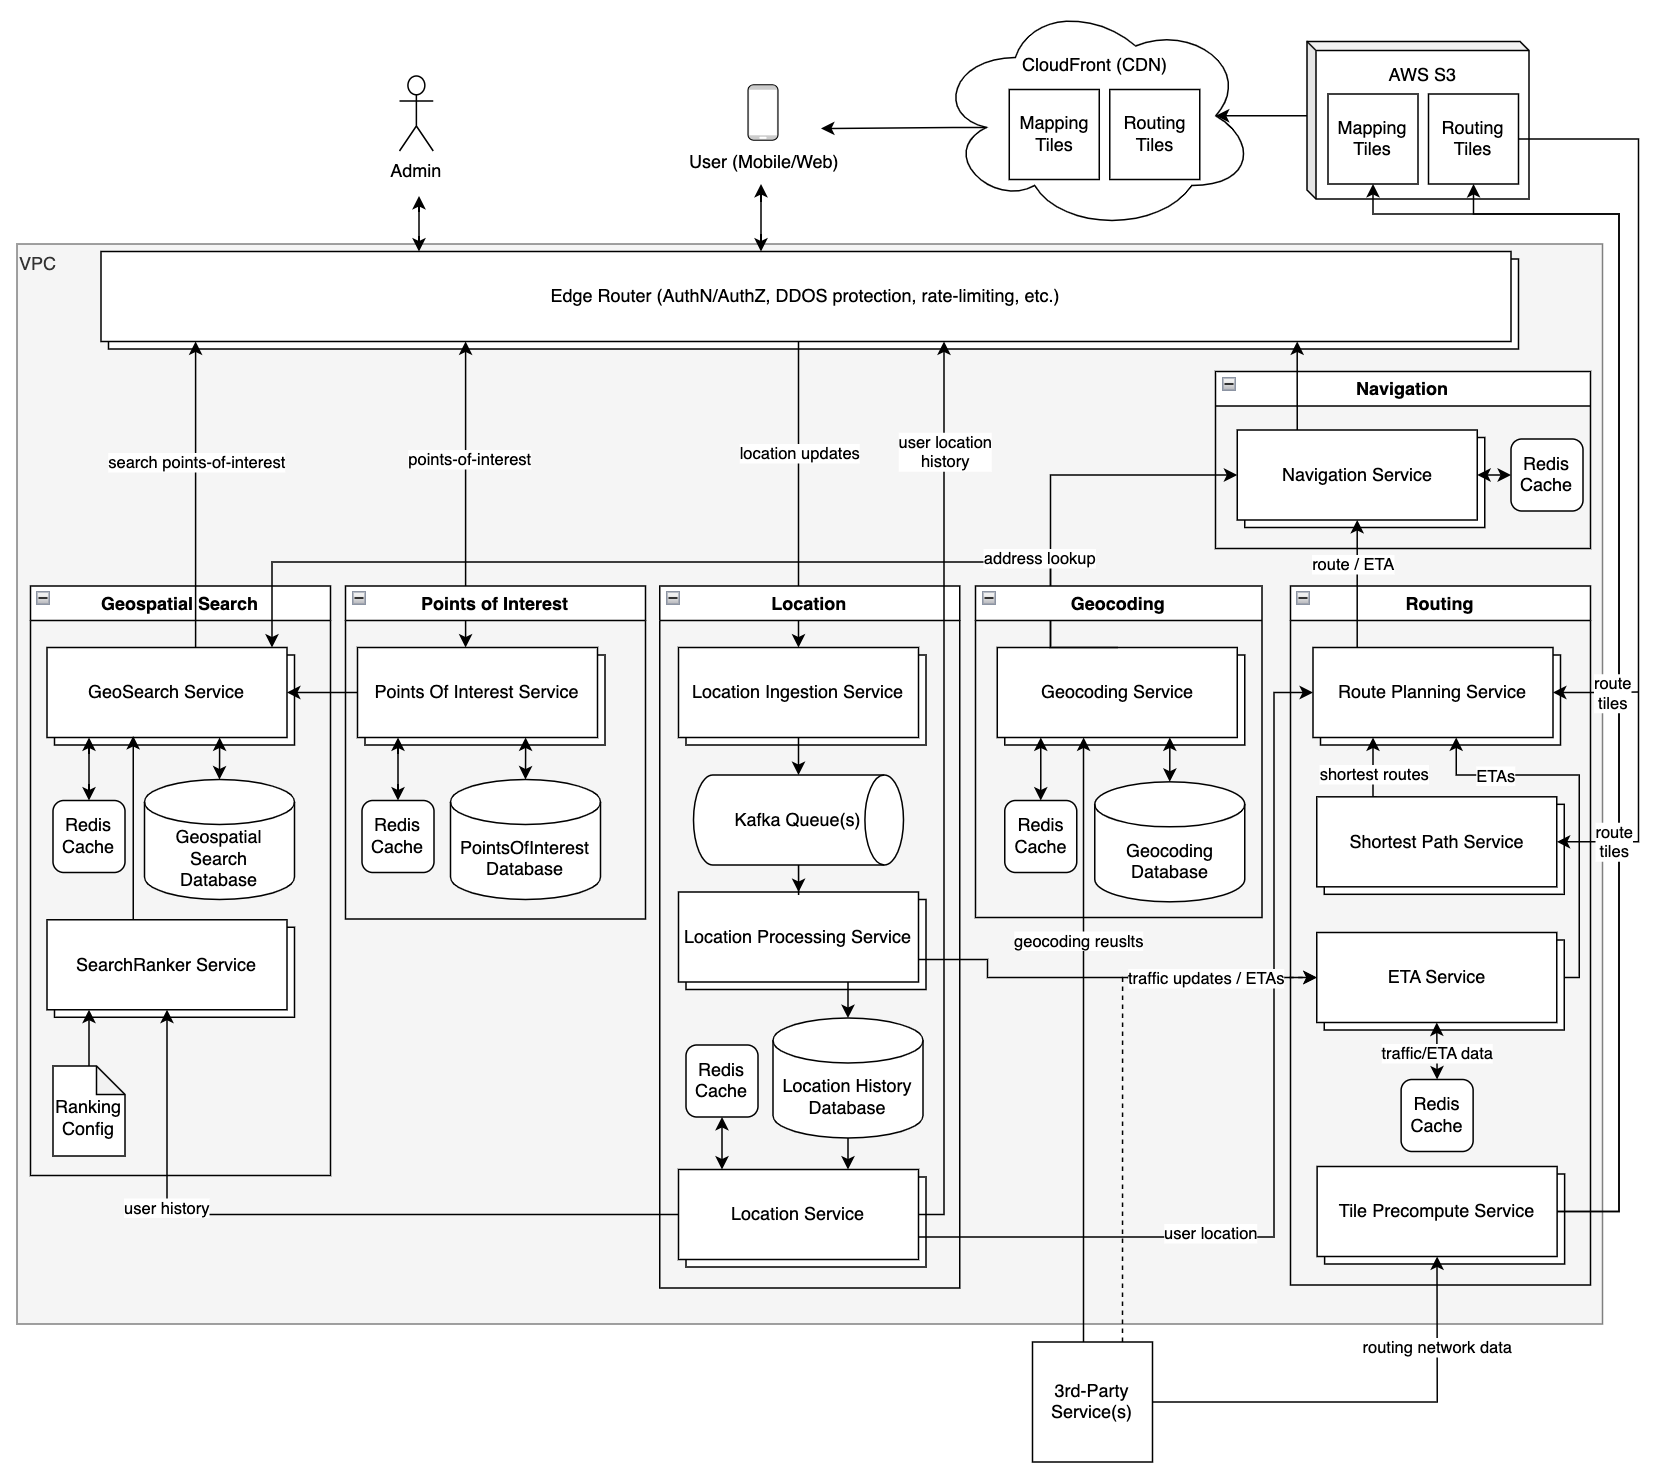
Domains and Services
Geocoding
Geocoding Service
The Geocoding Service is responsible for converting an address to a lat+lng pair. Both the Navigation Service and GeoSearch Service call the Geocode Service to convert the user-entered address into lat+lng coordinates. Initially these results will come from a third-party API, persisted to a Geocoding Database, and cached in Redis. Over time fewer calls will need to rely on the third-party API. Caching geocode lookups in-memory with Redis works well here given the high reads and low writes.
Points of Interest
Points Of Interest Service
The PointsOfInterest Service manages metadata about each point of interest including ID, address, lat+lng, name, description, and point type (e.g. restaurant). This is a basic CRUD service supporting reads, writes, updates, and deletes.
Geospatial Search
GeoSearch Service
The GeoSearch Service returns points of interest as users query for points of interest. We need to support searching by a combination of: (A) lat+lng or address, (B) search radius, and (C) a set of filters such as point-type. As discussed above in the data model section, these points will be stored by geohash. When the user submits their search, if submitting an address, we first convert that to lat+lng coordinates. It then calculates the geohash for the coordinates and the 8 neighboring cells geohashes. The GeoSearch Service then queries the Geospatial Search Database for points of interest within those geohashes. Upon receiving the list of results from the database the result is ranked.
Search Ranker Service
The SearchRanker Service takes a list of search results containing points of interest and ranks them by a combination of regional configuration specifying how to weight attributes and the users location history if they have visited any of the points of interest already. The ranked list is then returned to the GeoSearch Service.
Location
Location Ingestion Service
Every 30 seconds each active user’s location is updated and ingested by the Location Ingestion Service. This signal is used across many services in our design including ETA, navigation, and traffic. Given the significant load of data, even with condensing location updates to every 30 seconds per user, we will first send location updates to a stream processing queue in Kafka where the location data can then be processed and stored in the DB.
Location Processing Service
After the Location Ingestion Service enqueues the location updates into Kafka, the Location Processing Service dequeues this data across multiple workers keyed off the user-id. The data is processed and sent to the ETA service for ETA updates and to the Location History Database to support location queries.
Location Service
The Location Service returns the current location or location history of users. This data is consumed by the user when viewing their location history and by the SearchRanker Service when ranking a user’s search results.
Routing
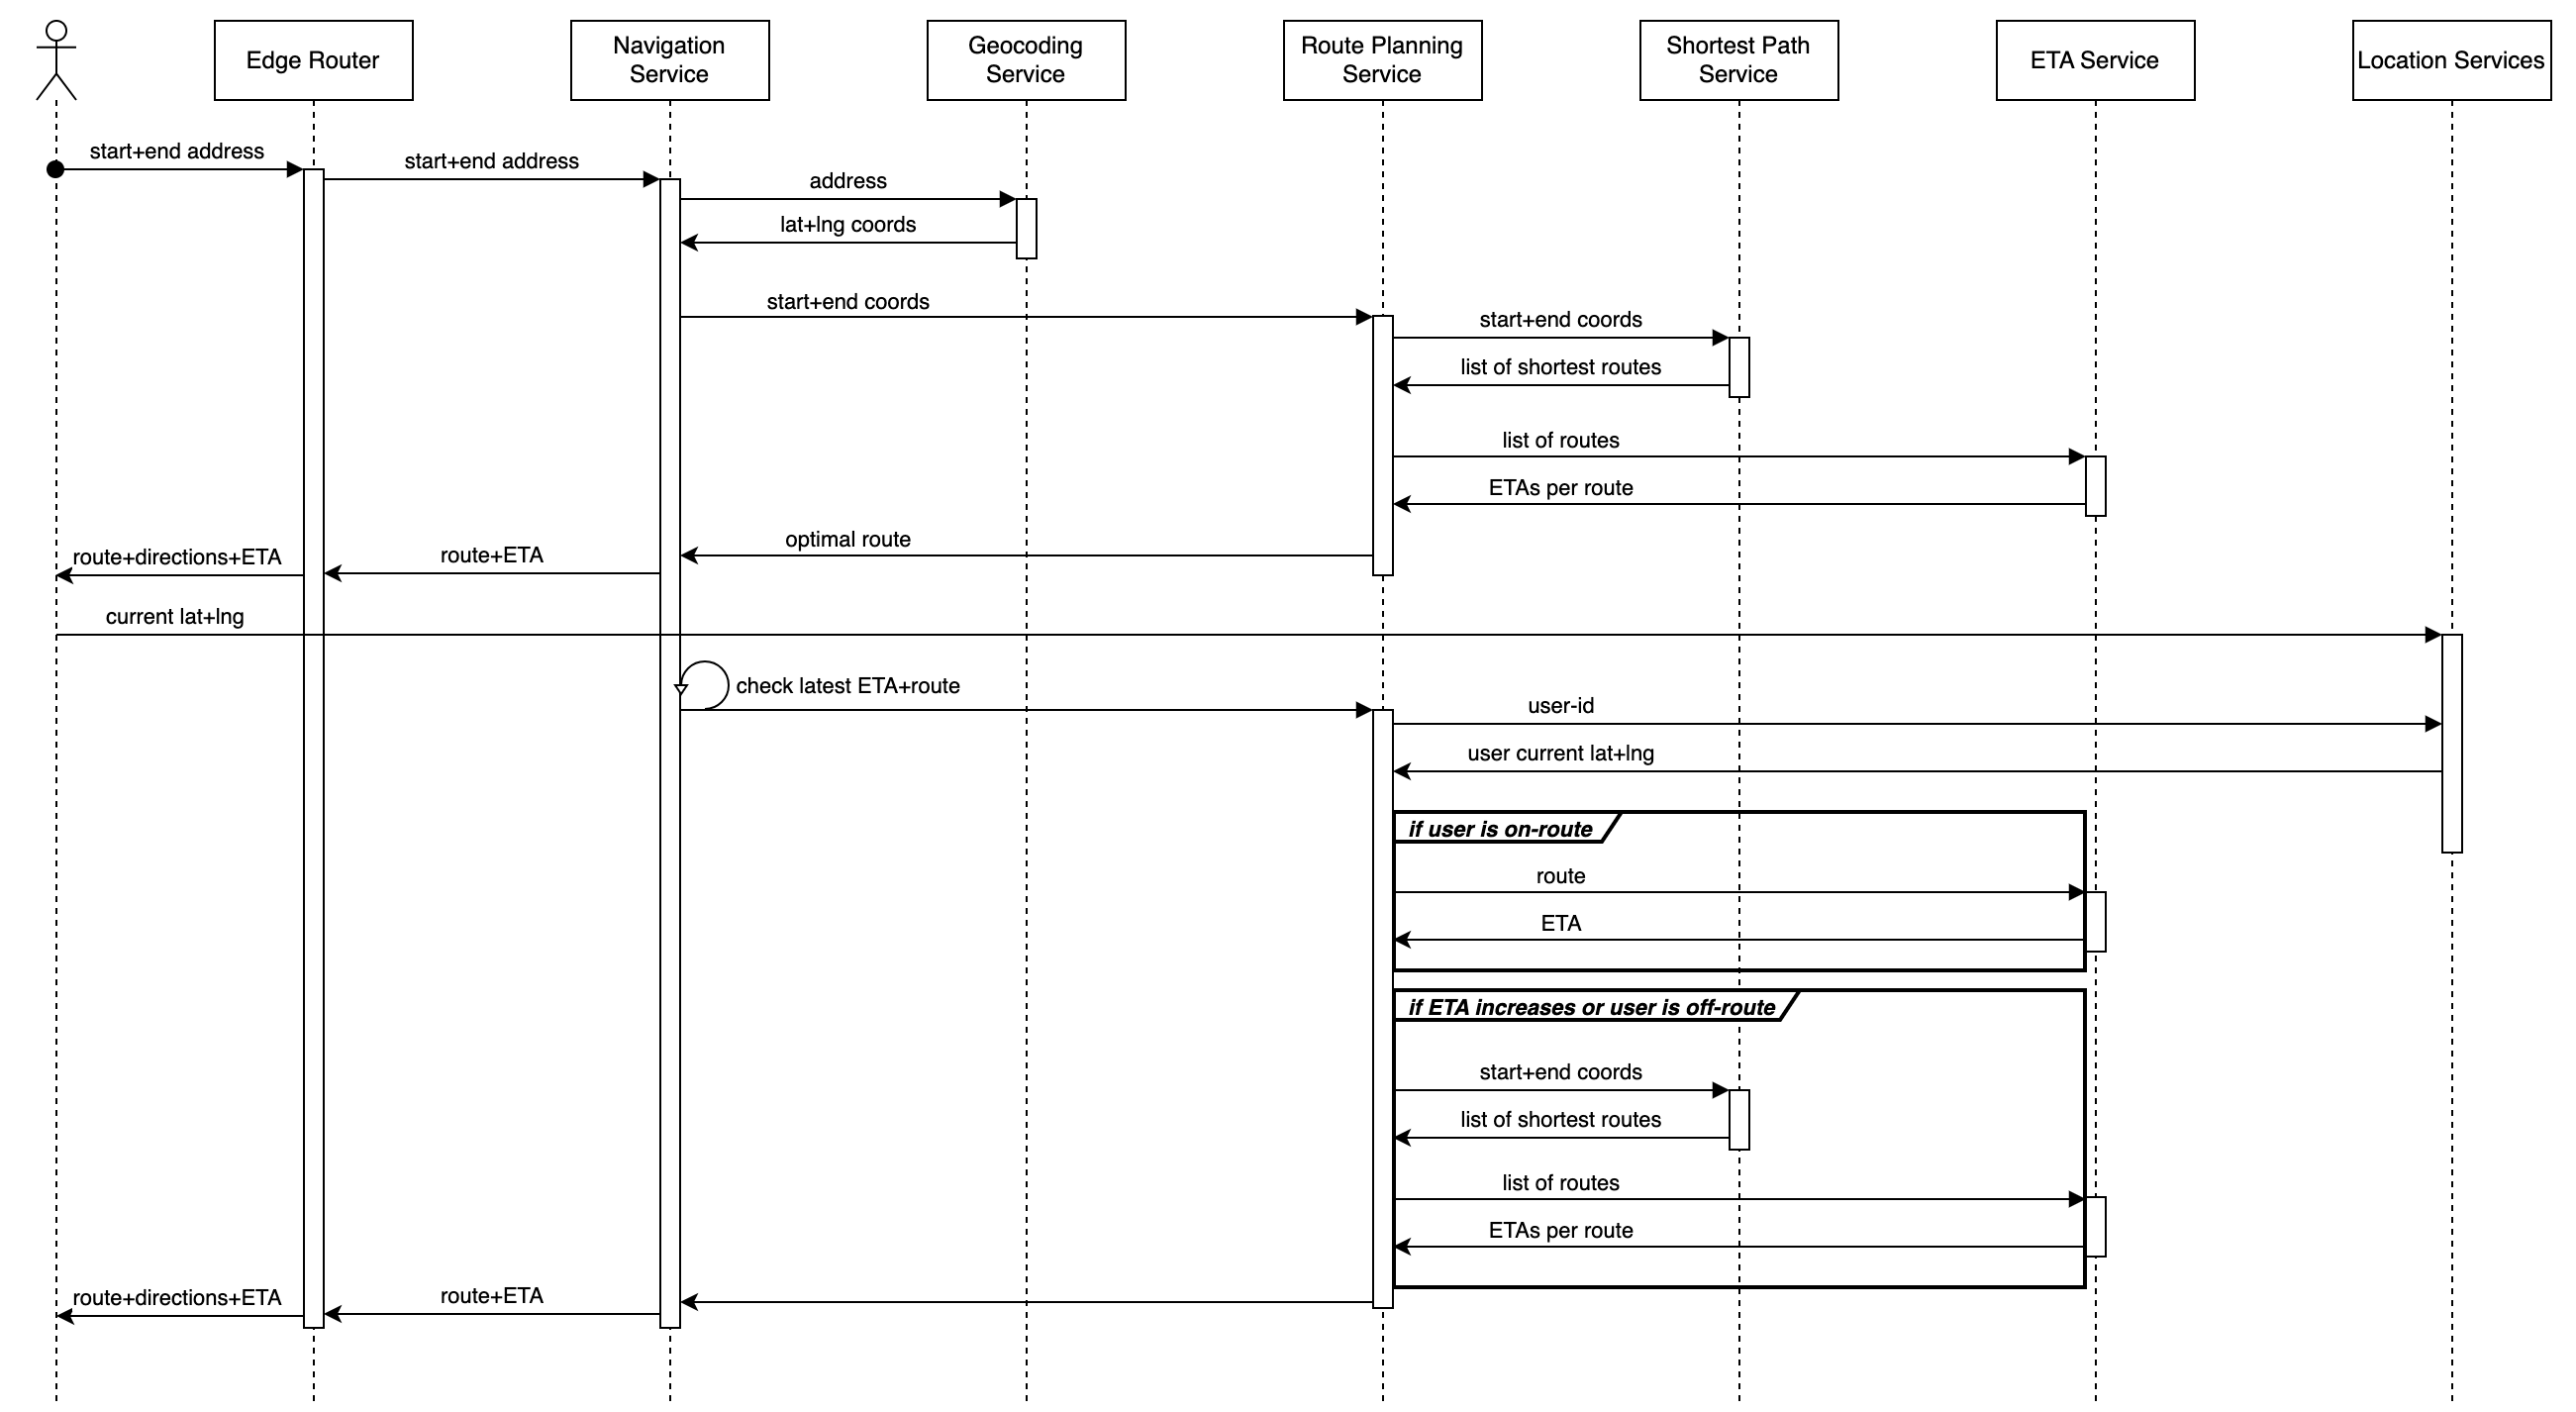
A sequence diagram of the services in the Routing domain is further below.
Route Planning Service
The Route Planning Service is responsible for providing the optimal route to the Navigation Service considering the travel time/distance and current traffic.
Once the Route Planning service has the list of shortest routes and their ETAs, it ranks the routes using whichever criteria we would like. We will prioritize the quickest arrival time, but may consider additional factors such as tolls, fuel consumption, and carbon emissions in the future,
Shortest Path Service
The Shortest Path Service receives two pairs of latitude and longitude coordinates for the origin and destination and returns a list of the shortest paths from origin to destination in ascending order without considering realt-ime signals like traffic. It converts the two latitude and longitude coordinate pairs into geohashes and then loads the origin and destination routing tiles at the highest resolution.
The network of roads is modeled as a graph where each node represents an intersection and each edge a road between two intersections. The edges have weights representing either the time or distance between two nodes and include additional metadata such as one-way streets, turn restrictions, or speed limits. This data is persisted to a no-sql or graph database along with in-memory storage for quick lookups. The Shortest Path Service traverses the graph and calculates the shortest route using an implementation of the A* shortest-path routing algorithm covered in Graph Theory and Shortest-Path Routing Algorithms against our routing graph. The A* Algorithm can be thought of as an optimized Dijkstra’s Algorithm using heuristics focused on a single start-location and a single end-location while updating the graph edge weights in real-time. As the routing algorithm is evaluated, tiles we have precomputed are loaded by their geohash, including desired zoom-level, from object-storage in S3. The service then returns a list of the shortest paths in ascending order. At first we may leverage a third-party service for the transit graph source data and routing logic such as the open-source OSRM C++ routing engine while we build our own logic and collect transit data.
ETA Forecasting Service with Machine Learning
Every few minutes the ETA Forecasting Service retrieves updated traffic information, forecasts what traffic will be in the near future, and updates our traffic persistence store. The forecasting requires historical data which won’t be available when we initially launch our delivery platform to new geographies so we will leverage open-source traffic data to avoid a “cold-start problem” where we have no initial historical dataset to base estimates off of.
As we scale, have more driver data, and require more precise ETA’s we will leverage machine learning forecasting logic using our own historical routing data to fine-tune the transit-time estimates. Every few minutes the ETA Forecasting Service will receive fresh data from the Location Processing Service and run the model inference to forecast traffic in the near future which the ETA Service can leverage in its estimates. A Graph Neural Network is a good model for this.
ETA Service
The ETA service leverages the distributed in-memory persistence store populated by the ETA Forecasting Service to quickly respond to queries on transit time considering traffic. We will store ETAs seprately per mode of transport we support (e.g. driving, biking, walking).
Tile Precompute Service
Each week the Tile Precompute Service will update the mapping and routing tiles with any changes to the imagery or road network. The network graph data will be consumed from a third-party service and turned into mapping and routing tiles. These tiles are then published to object-storage in AWS S3 and cached at the user’s nearest point-of-presence (PoP) using the AWS CloudFront CDN.
Searching Points of Interest User Flow
To search for points of interest, a user submits a search query with destination lat+lng, radius, and a set of filters such as point-type. The request is sent through the edge router to the GeoSearch Service. The GeoSearch Service uses the Geocoding Service to transform the lat+lng into a geohash, with length/granularity determined by the radius. The service then calculates adjacent geohashes, typically 8 cells, to alleviate boundary issues discussed above. With the 9 prefixes the GeoSearch service queries the database with each in parallel. Once the database reaches scale and is sharded on geohash prefix, separate cells may route to different database shards. Upon receiving the response from the database the result set is ranked (and filtered if needed) based on various criteria and then results returned to the user.
Navigation User Flow
The Navigation Service is responsible for quickly determining the shortest-path between the user and their end destination, optimizing for travel time, though in the future could also consider tolls, fuel consumption and carbon emissions.
ETA Changes, Traffic, and Rerouting
To support updating a user’s navigation and route when traffic conditions change or they deviate from the route, we must actively track navigating users and find an efficient way of determining which users are impacted upon traffic updates, as well as when users deviate from their route. On a regular cadence, say every 15 seconds, the Navigation Service re-queries the Route Planning Service to confirm the current route is the most optimal and to get the latest ETA.
In addition to simply updating users currently enroute with their latest ETA, we must also consider rerouting the user if the ETA increases or they deviate from the provided route. First the Route Planning Service looks up the user’s current location and if it is along their route. If they are on-route the Route Planning Service requests the latest ETA considering traffic data for that user’s remaining route. If the user is either off-route or their ETA has gone up rather than down, the Route Planning Service requests a new set of shortest routes and ETAs. This can be optimized further in the future by checking which traffic updates impact which routing tiles and pushing route and ETA updates to each impacted user. This can be made even faster by rather than checking each routing tile of each active route, to only look at the lowest-resolution routing tile covering both the origin and destination locations and checking if the traffic update is included in that routing tile.
